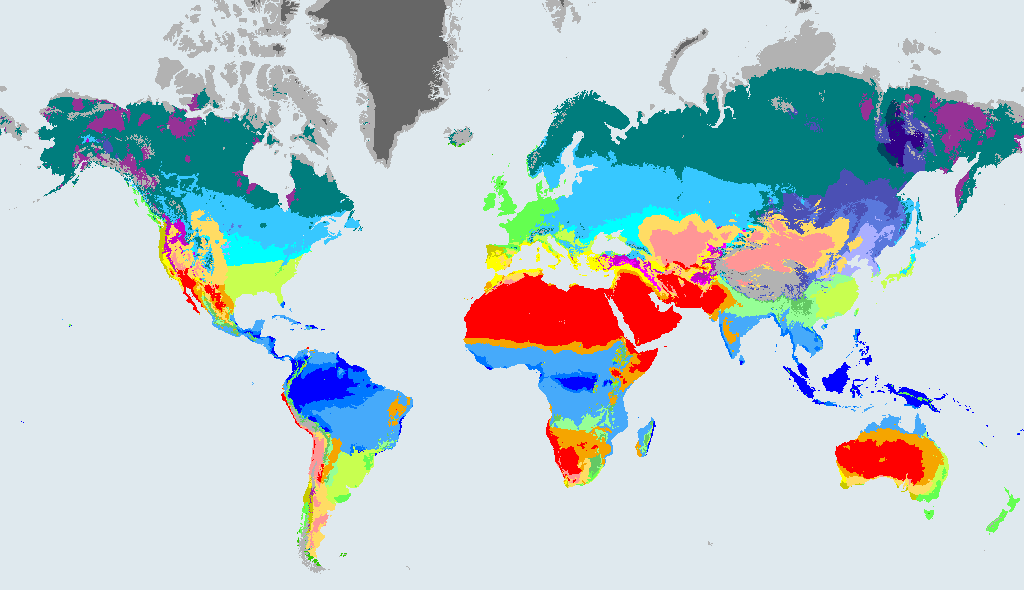
The climate of Adelaide
Csb Warm-summer Mediterranean. Dry, warm summers and mild, wetter winters. Like the hot-summer Mediterranean climate, but summers are a little cooler, often because of cool ocean currents or altitude.
Adelaide is south of the equator, so its seasons run the opposite way to those in Europe: summer falls in December to February and winter in June to August. The 1901 to 1930 map puts Adelaide in the same zone, Csb.
Adelaide: then, now and by 2100
| Map | Climate zone | Compared with now |
|---|---|---|
| 1901 to 1930 | Csb Warm-summer Mediterranean | Same as now |
| 1991 to 2020 (now) | Csb Warm-summer Mediterranean | - |
| 2071 to 2099, SSP1-2.6 (low emissions) | Csa Hot-summer Mediterranean | Different from now |
| 2071 to 2099, SSP2-4.5 (middle of the road) | Csa Hot-summer Mediterranean | Different from now |
| 2071 to 2099, SSP5-8.5 (high emissions) | Csa Hot-summer Mediterranean | Different from now |
The 2071 to 2099 rows are model projections under three emissions scenarios, not forecasts. The 1901 to 1930 row is a reconstruction. All come from Beck et al. (2023).
Under the middle-of-the-road scenario (SSP2-4.5), the model puts Adelaide in Csa (hot-summer mediterranean) in 2071 to 2099, instead of Csb now. Under the high-emissions scenario (SSP5-8.5) it is Csa (hot-summer mediterranean).
Cities with the same climate as Adelaide
Other big cities that are Csb (warm-summer mediterranean) in 1991 to 2020, at most two per country:
- Cape Town, South Africa
- Quito, Ecuador
- San Jose, United States
- San Francisco, United States
Where Adelaide's future climate exists today
In the SSP2-4.5 map for 2071 to 2099, Adelaide is Csa. These cities are Csa in 1991 to 2020, so they give a rough idea of the future climate (the real conditions would differ in many ways).
- Istanbul, Turkey
- Los Angeles, United States
- Casablanca, Morocco
- Ankara, Turkey
- Algiers, Algeria
- Rome, Italy
- Tashkent, Uzbekistan
- Beirut, Lebanon
More
Population of Adelaide from GeoNames: 1,469,163 (rank 340 in our list of 1,000). Climate data: Beck et al. (2023), CC BY 4.0. Data sources and licences.