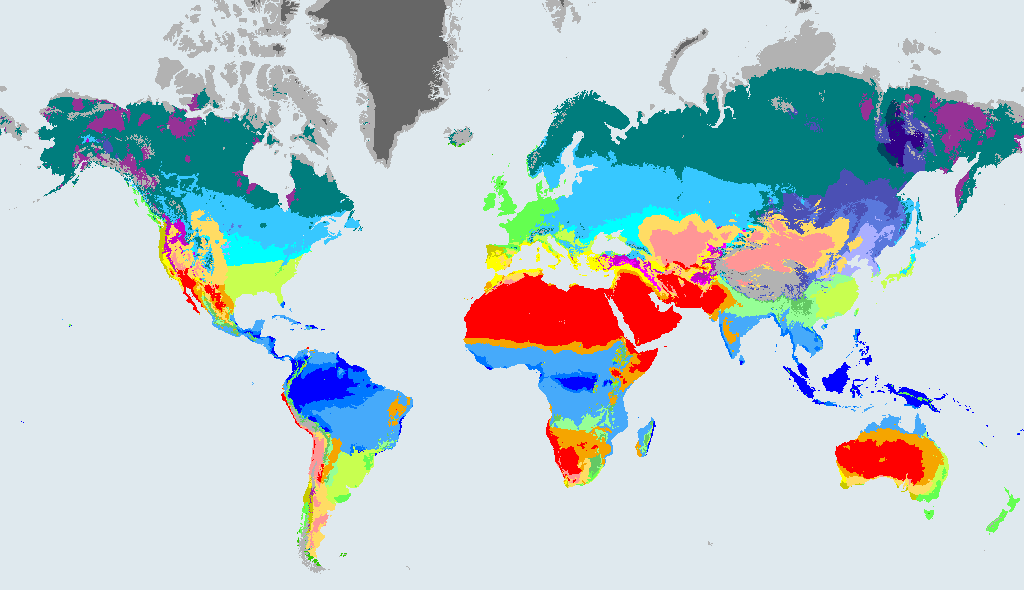
Climate zones in São Tomé and Príncipe, 1991 to 2020
Share of São Tomé and Príncipe's classified land in each Köppen-Geiger zone in 1991 to 2020. Zones under 0.05% are left out. The 1,131 map cells used cover 93% of the country's outline (about 971 km²).
By major group: A (tropical) 97%, C (temperate) 3.2%.
São Tomé and Príncipe has no single dominant climate. The biggest zone, Am (tropical monsoon), covers only 48% of its classified land in 1991 to 2020, followed by Aw (46%) and Cwb (3.2%). 4 zones each cover 1% or more of it. In plain terms, tropical monsoon means hot all year, with a very wet season and a short dry spell. Under the middle-of-the-road scenario (SSP2-4.5), 27% of its land is projected to be in a different zone by 2071 to 2099, with the biggest gain going to Aw (tropical savannah). The most common zone would then be Aw (tropical savannah).
How São Tomé and Príncipe's zones have changed and may change
Each row compares a map with 1991 to 2020. "Share in a different zone" is the share of the country's area whose class is different from 1991 to 2020. Future rows are model projections under an emissions scenario, not forecasts.
| Map | Share in a different zone | Different major group | Biggest gain | Biggest loss |
|---|---|---|---|---|
| 1901 to 1930 (past) | 9.4% | 0.4% | Am +4.3 percentage points | Aw -6.5 percentage points |
| 2071 to 2099, SSP1-2.6 (low emissions) | 36% | 2.6% | Aw +31.4 percentage points | Am -27.2 percentage points |
| 2071 to 2099, SSP2-4.5 (middle of the road) | 27% | 3% | Aw +22.2 percentage points | Am -17.6 percentage points |
| 2071 to 2099, SSP5-8.5 (high emissions) | 22% | 3.2% | Aw +14.1 percentage points | Am -9.3 percentage points |
For the past row, the comparison runs the other way: the 1901 to 1930 map against 1991 to 2020.
Zone shares by map
| Zone | 1901 to 1930 | 1991 to 2020 | SSP1-2.6 (2071 to 2099) | SSP2-4.5 (2071 to 2099) | SSP5-8.5 (2071 to 2099) |
|---|---|---|---|---|---|
| Am Tropical monsoon | 44% | 48% | 21% | 31% | 39% |
| Aw Tropical savannah | 53% | 46% | 78% | 68% | 60% |
| Cwb Subtropical highland (dry winter) | 3.6% | 3.2% | 0.6% | 0.2% | - |
| Af Tropical rainforest | - | 2.6% | 1% | 1% | 1% |
Percentages are of the country's classified land in each map. A dash means under 0.05%.
Zones found in São Tomé and Príncipe
Data: Beck et al. (2023), CC BY 4.0; country outlines from Natural Earth. In 1901 to 1930 the most common zone was Aw. See data sources and licences.