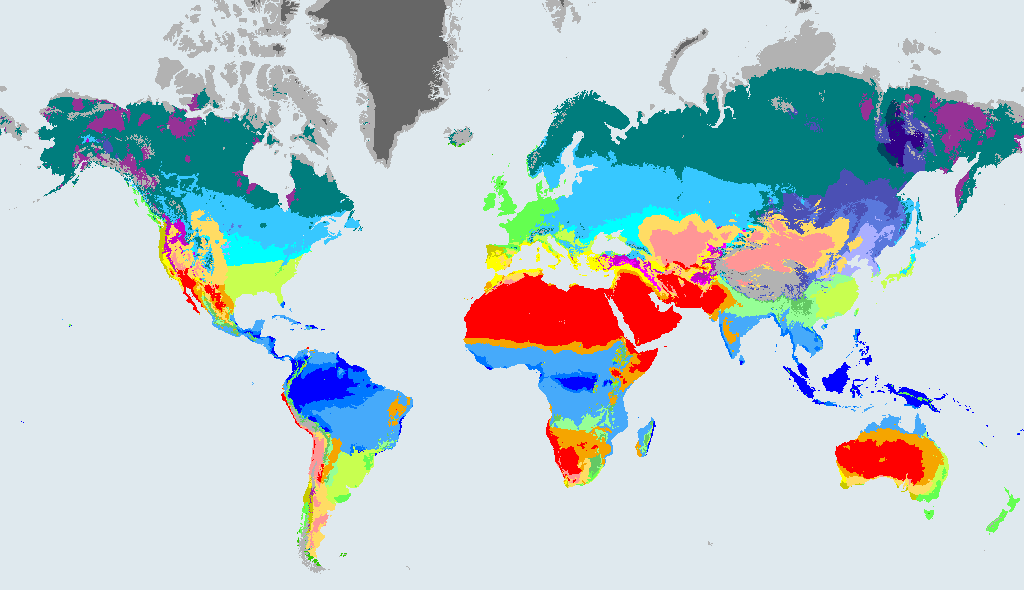
Climate zones in Tanzania, 1991 to 2020
Share of Tanzania's classified land in each Köppen-Geiger zone in 1991 to 2020. Zones under 0.05% are left out. The 1,108,612 map cells used cover 100% of the country's outline (about 945,169 km²).
By major group: A (tropical) 76%, C (temperate) 12%, B (arid) 12%.
Aw, tropical savannah, is the main climate of Tanzania, covering 75% of its classified land in 1991 to 2020, with BSh (hot semi-arid (steppe)) next at 12%. In plain terms, tropical savannah means hot all year, with a clear dry season. Under the middle-of-the-road scenario (SSP2-4.5), 12% of its land is projected to be in a different zone by 2071 to 2099, with the biggest gain going to Aw (tropical savannah).
How Tanzania's zones have changed and may change
Each row compares a map with 1991 to 2020. "Share in a different zone" is the share of the country's area whose class is different from 1991 to 2020. Future rows are model projections under an emissions scenario, not forecasts.
| Map | Share in a different zone | Different major group | Biggest gain | Biggest loss |
|---|---|---|---|---|
| 1901 to 1930 (past) | 15% | 12% | Aw +9.9 percentage points | Cwb -4.1 percentage points |
| 2071 to 2099, SSP1-2.6 (low emissions) | 9.1% | 6.7% | Aw +3.8 percentage points | Cwb -3 percentage points |
| 2071 to 2099, SSP2-4.5 (middle of the road) | 12% | 10% | Aw +7.5 percentage points | Cwb -4.9 percentage points |
| 2071 to 2099, SSP5-8.5 (high emissions) | 15% | 14% | Aw +10.8 percentage points | Cwb -6.8 percentage points |
For the past row, the comparison runs the other way: the 1901 to 1930 map against 1991 to 2020.
Zone shares by map
| Zone | 1901 to 1930 | 1991 to 2020 | SSP1-2.6 (2071 to 2099) | SSP2-4.5 (2071 to 2099) | SSP5-8.5 (2071 to 2099) |
|---|---|---|---|---|---|
| Aw Tropical savannah | 65% | 75% | 79% | 82% | 86% |
| BSh Hot semi-arid (steppe) | 14% | 12% | 12% | 12% | 11% |
| Cwb Subtropical highland (dry winter) | 12% | 7.9% | 4.9% | 2.9% | 1.1% |
| Cwa Humid subtropical with dry winter | 4.8% | 3.4% | 2.4% | 1.4% | 0.7% |
| Am Tropical monsoon | 1.6% | 1.5% | 1.7% | 1.6% | 1.8% |
| Cfb Temperate oceanic | 0.8% | 0.4% | 0.4% | 0.3% | 0.2% |
| Af Tropical rainforest | 0.4% | 0.2% | - | - | - |
| Cfa Humid subtropical | 0.3% | 0.1% | - | - | - |
| Csb Warm-summer Mediterranean | 0.9% | 0.1% | - | - | - |
| Csa Hot-summer Mediterranean | 0.3% | - | - | - | - |
| ET Tundra | 0.1% | - | - | - | - |
Percentages are of the country's classified land in each map. A dash means under 0.05%.
Cities in Tanzania and their climate zones
| City | 1991 to 2020 | 2071 to 2099, SSP2-4.5 |
|---|---|---|
| Dar es Salaam | Aw Tropical savannah | Aw Tropical savannah |
| Mwanza | Aw Tropical savannah | Aw Tropical savannah |
| Dodoma | BSh Hot semi-arid (steppe) | BSh Hot semi-arid (steppe) |
| Zanzibar | Am Tropical monsoon | Am Tropical monsoon |
| Arusha | Aw Tropical savannah | Aw Tropical savannah |
Zones found in Tanzania
Data: Beck et al. (2023), CC BY 4.0; country outlines from Natural Earth. In 1901 to 1930 the most common zone was Aw. See data sources and licences.