Aurangabad climate zone

Aurangabad, India: Aw, tropical savannah, in 1991 to 2020.

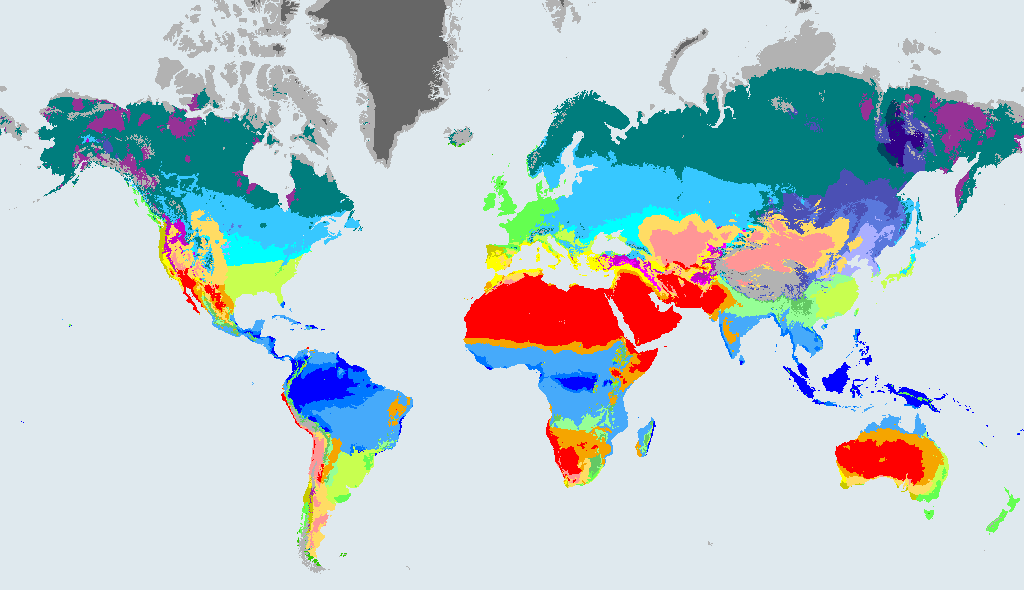
World map of Köppen-Geiger climate zones, 1991 to 2020Tap or scroll to load the interactive map

Period shown on the map
80%

Köppen-Geiger classes are based on 30-year averages of temperature and rain, not on the weather on any one day.

Key

A: Tropical

  • Af Tropical rainforest
  • Am Tropical monsoon
  • Aw Tropical savannah

B: Arid

  • BWh Hot desert
  • BWk Cold desert
  • BSh Hot semi-arid (steppe)
  • BSk Cold semi-arid (steppe)

C: Temperate

  • Csa Hot-summer Mediterranean
  • Csb Warm-summer Mediterranean
  • Csc Cold-summer Mediterranean
  • Cwa Humid subtropical with dry winter
  • Cwb Subtropical highland (dry winter)
  • Cwc Cold subtropical highland (dry winter)
  • Cfa Humid subtropical
  • Cfb Temperate oceanic
  • Cfc Subpolar oceanic

D: Cold (continental)

  • Dsa Hot-summer continental with dry summer
  • Dsb Warm-summer continental with dry summer
  • Dsc Subarctic with dry summer
  • Dsd Subarctic with dry summer and very cold winter
  • Dwa Hot-summer continental with dry winter
  • Dwb Warm-summer continental with dry winter
  • Dwc Subarctic with dry winter
  • Dwd Subarctic with dry winter and very cold winter
  • Dfa Hot-summer humid continental
  • Dfb Warm-summer humid continental
  • Dfc Subarctic (boreal)
  • Dfd Subarctic with very cold winter

E: Polar

  • ET Tundra
  • EF Ice cap (frost)

How to read the map. Each colour is a Köppen-Geiger climate class. The first letter is the major group (A tropical, B arid, C temperate, D cold, E polar); the other letters say how dry it is and how warm or cold. Tap anywhere to see the class under that spot in 1901 to 1930, 1991 to 2020 and, under three emissions scenarios, 2071 to 2099. The codes and names are always given in words, because colour alone is hard to tell apart for some people.

The climate of Aurangabad

Aw Tropical savannah. Hot all year, with a clear dry season. Warm throughout, with a wet season and a distinct dry season long and dry enough for grassland and scattered trees rather than closed forest.

The 1901 to 1930 map put Aurangabad in BSh (hot semi-arid (steppe)), so its zone is different from a century ago.

Aurangabad: then, now and by 2100

MapClimate zoneCompared with now
1901 to 1930BSh Hot semi-arid (steppe)Different from now
1991 to 2020 (now)Aw Tropical savannah-
2071 to 2099, SSP1-2.6 (low emissions)Aw Tropical savannahSame as now
2071 to 2099, SSP2-4.5 (middle of the road)Aw Tropical savannahSame as now
2071 to 2099, SSP5-8.5 (high emissions)Aw Tropical savannahSame as now

The 2071 to 2099 rows are model projections under three emissions scenarios, not forecasts. The 1901 to 1930 row is a reconstruction. All come from Beck et al. (2023).

Under the middle-of-the-road scenario (SSP2-4.5), the model keeps Aurangabad in Aw in 2071 to 2099. The high-emissions scenario (SSP5-8.5) gives the same answer.

Cities with the same climate as Aurangabad

Other big cities that are Aw (tropical savannah) in 1991 to 2020, at most two per country:

More

Population of Aurangabad from GeoNames: 1,175,116 (rank 468 in our list of 1,000). Climate data: Beck et al. (2023), CC BY 4.0. Data sources and licences.

Embed this map

Copy this code into your web page. It is free to use. Please keep the link under the map, as it is how people find where the map comes from.